How to kick-start your market research using automotive sales figures
New vehicle registrations and used vehicles

Car sales figures are a level down from the auto indicators. Get an in depth analysis of how the passenger car demand is evolving in our automotive industry reports.
You need to look at both passenger cars sales and commercial vehicles sales to fully cover the topic.
They are basically calculated with two main features:
- New vehicles: this indicator comes from the number of registrations which have been made after a new purchase. As this data is solely on new vehicle sales, they are more limited to developed countries and markets.
- Used vehicles: These stats present the sales of all second hand vehicles.
The share of new vs used vehicles transactions is an important metric to understand a given market.The automobile market includes a secondary market, called the aftermarket- which operates after a car was bought.
How are they used?

Auto sales statistics show the situation of each market among the global top markets such as the USA, Europe, Asia, etc. For instance, get some information about US manufacturers sales performances in March 2015 but also on more global results such as sales numbers from February 2015.
They also show the audience’s preferences in car branding and different vehicle manufacturers. Vehicle transaction statistics play a key role in both the purchase and distribution process.
How key performance indicators report are usually presented?
The most common statistics are monthly, even if quarterly and yearly graphs are also produced. They are always made by calculating both new vehicle registrations straight related with the trade report. The information usually come in tables, be broken down by:
- Manufacturer (with information such as revenue/car sold)
- Market
- Region
- Unit sold & sales forecast (e.g. when Cadillac plans to sell 500,000 annually by 2020)
- % change
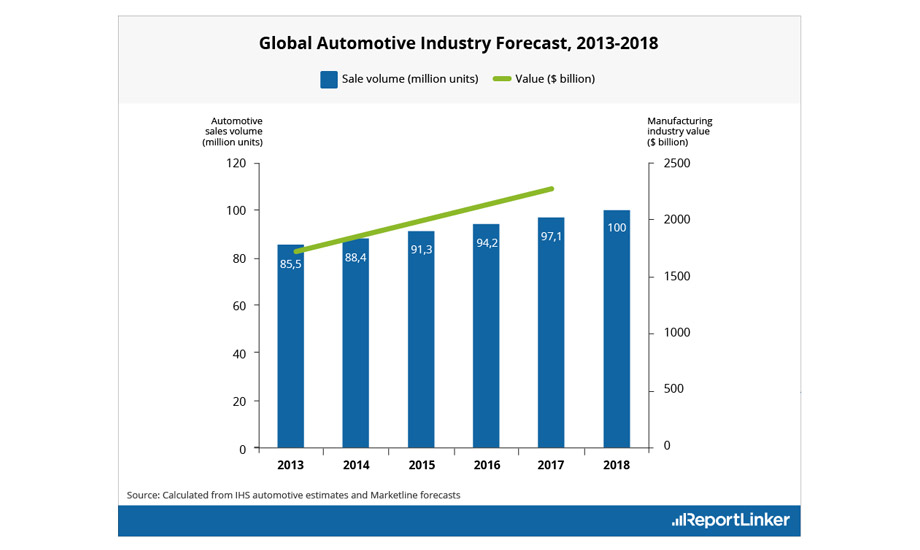
Global industry forecast
For example in 2013 Global vehicle deals are projected to increase from 85 million units to 100 million units by 2018, according to IHS. The market value is expected to increase from $1.7 trillion to $2.3 trillion during the same period.
The U.S.market (which recorded its strongest growth rate in a decade in May 2015) will be driven by demand for lighter cars. In Western Europe, replacement of old cars and a rebound in small car sales will drive growth. The Asian market is expected to show variations. India is expected to see good growth under the new Modi administration.
In China, however, there is a danger that the end of the credit boom might lead to a slow-down. Japan is already experiencing a decline due to a 3% consumption-tax hike.
Relevant business information sources
You may be interested in looking at the following official statistics publisher: ReportLinker only uses reputable and reliable sources, which specialize on car sales figures and vehicle industry research, as well as the car market analysis. Here are the top sources on sales data – annual, monthly and etc – we use in our website:
- Business statistics by OICA
- Auto Sales and Market Data Centre by WSJ
- MarketLine with an independent Automotive Sales Statistics sector
- KPMG as a top source for current news, researches, surveys, analyzes and statistics in the world
- The Data Centre and automotive statistics by WardsAuto
- Nada DATA by DATA that incorporates the USA Automotive Statistics
You might be interested in:
- Automotive trade: You will learn important information about the distribution of vehicles inside the market, vehicle movement from one market to another.
- Automotive production: They show the progress in cars and trucks, including numbers of both the production of cars and car parts.
 Written By
Lewis Pearson