How to find the most relevant automotive figures
Key statistics that will help you present your research
When conducting a market research on the auto industry, you should look at KPIs in three main categories:
- Production
- Sales
- Trade
They incorporate manufacturing data and growth predictions of a market, region, or company. Some of the statistical overviews might include each of these three categories when an entire market is involved.
Within these figures the following types of vehicle are covered:
- Passenger cars
- Light commercial vehicles
- Heavy trucks
- Buses and coaches
Production

These figures show how many vehicles (passenger car and light commercial vehicle) were produced globally, in one particular developed or emerging country, or in one single company only.
They are often broken down by:
- Types of Motor vehicle type: cars or commercial vehicles
- Month, quarter or year
- Region or country
- Manufacturer
- Production in units and % change
Sales

Sales figures include information about the new vehicle registration number (passenger car registrations), as well as the sales of used vehicles.
They usually come in monthly, quarterly and yearly tables and present the number of sold new or old vehicle (passenger car and light commercial vehicle) by country. Sales results directly impact a company's yearly results, for instance, it has allowed FCA to declare profits for the second consecutive quarter in Europe in 2015.
Reports on automobile sales can also include other components influencing results such as a list of insurance prices per state and per model.
Trade

Trade figures are broken down in:
- Factory sales
- Retail sales
- Imports and exports
- Apparent consumptions
- Suggested retail prices (which can vary from one country to another both for new and used-cars, e.g. Used-car prices reached a record high in the US in 2014)
- Trade balances
- Top market shares by country
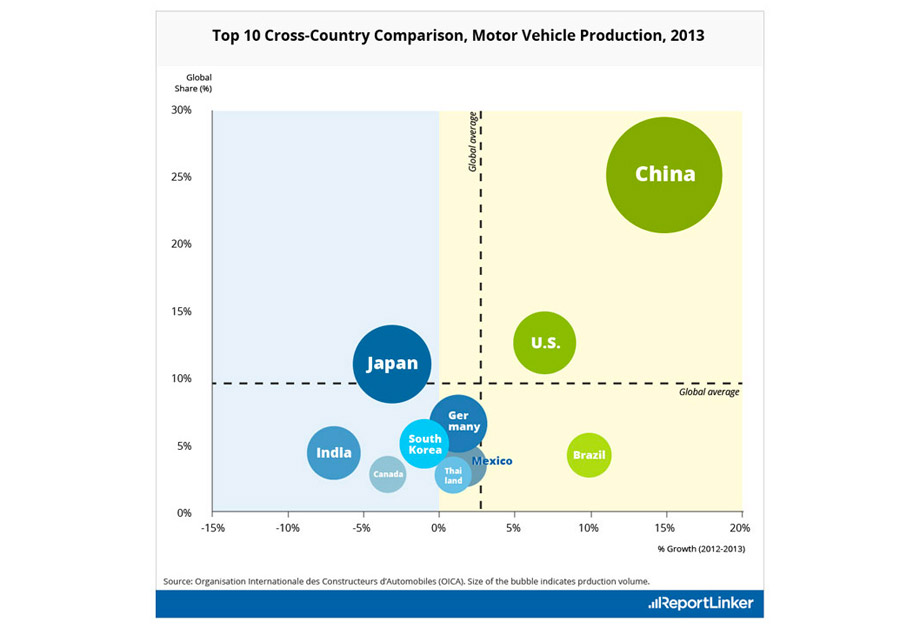
For example in 2013 China’s motor vehicle production grew by 15% to reach 22.1 million units, according to OICA, while Japan’s production fell. Volume in the U.S. grew by 7% to reach 16 million units in 2013. By 2014, 30% of automobile production is forecast to come from Brazil, Russia, India and China (the BRICs), according to the Boston Consulting Group.
The best sources to deepen your analysis
ReportLinker relies on the most reputable companies, non-profit organizations, and official institutions to provide you with relevant data and the most objective information.
Trade statistics
- Organisation Internationale des Constructeurs d'Automobiles (OICA)
- European Automobile Manufacturers Association (EAMA)
- Society of Motor Manufacturers and Traders (SMMT)
- Japan Automobile Manufacturers Association (JAMA)
Automotive publications
- Global Automakers
- American International Automobile Dealers Association
- Annual Reports of the Ministry of Heavy Industries and Public Enterprises
- Society of Indian Automobile manufacturers
- Automotive Component Manufacturers Association (ACM)
- Automotive Aftermarket Industry Association (AIA)
- Department of Heavy Industries (DHI)
- American International Automobile Dealers Association (AIADA)
You might be interested in:
- Car Trends: The car industry has main elements which are also influenced by different factors and newly emerging trends. These sectors might be determined according to the main products an automotive leading manufacturer can provide – automobile field, car sector, truck center, etc.
- Vehicle Reports: Global Automotive Report, Country Automotive Report and even Automotive Report.
- Automotive Companies: The car industry incorporates many organizations and companies. Thanks to our official classifications you can easily figure out what type of automotive companies present in today’s world automobile industry.
 Written By
Lewis Pearson